
"These are extraordinary times. We can't worry about the national debt now. We'll deal with that later."
This is what people defending massive deficit spending say. It sounds reasonable. Who wants to worry about the credit card bill while the house is on fire?
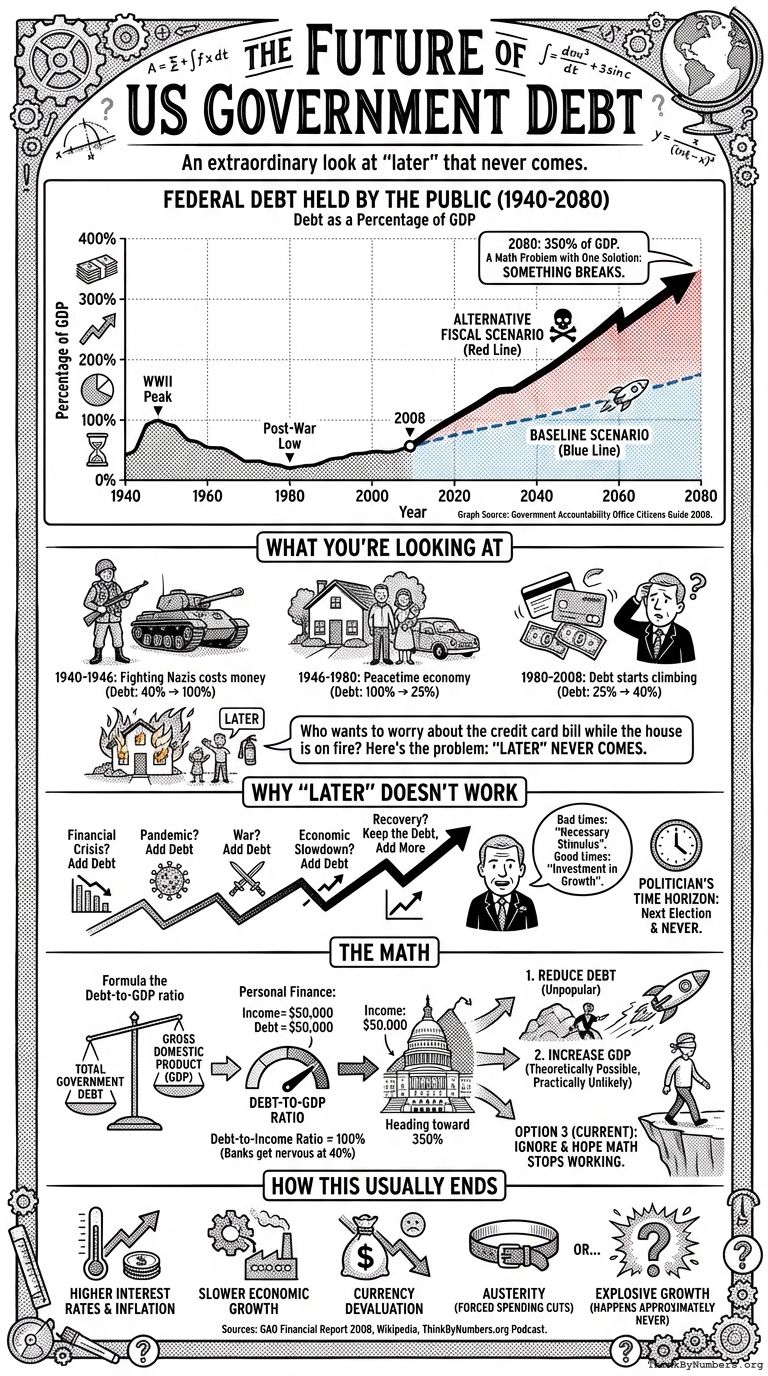
Here's the problem: "later" never comes.

Graph Source: Government Accountability Office Citizens Guide 2008
This chart shows federal debt held by the public from 1940 to 2080. The blue line is the baseline scenario. The red line is the "alternative fiscal scenario," which is government-speak for "what actually happens when politicians keep doing what they're doing."
What You're Looking At
In 1940, debt was around 40% of GDP. World War II pushed it to 100% of GDP by 1946. Fighting Nazis costs money, apparently.
After the war, debt fell to about 25% of GDP by 1980. Peacetime economies typically don't require selling war bonds to citizens who fear invasion.
Then things get interesting. Debt started climbing in the 1980s and never really stopped. By 2008, it was back to 40% of GDP.
The red line shows what happens if current policies continue. By 2040, debt reaches 200% of GDP. By 2080, it hits 350% of GDP.
That's not a prediction. It's a math problem with one solution: something breaks.
Why "Later" Doesn't Work
Every crisis becomes an excuse to add debt:
- Financial crisis? Add debt.
- Pandemic? Add debt.
- War? Add debt.
- Economic slowdown? Add debt.
- Recovery? Keep the debt, add more.
The pattern is simple. When times are bad, deficit spending is "necessary stimulus." When times are good, deficit spending is "investment in growth." The debt only goes one direction.
Politicians have two time horizons: the next election and never. Debt reduction falls into the "never" category.
The Math
Debt as a percentage of GDP works like this:
Debt-to-GDP ratio = Total Government Debt / Gross Domestic Product
If you earn $50,000 per year and owe $50,000, your debt-to-income ratio is 100%. Banks get nervous around 40%. The government is heading toward 350%.
You can fix this ratio two ways:
- Reduce debt (spend less than you collect)
- Increase GDP (grow the economy faster than the debt grows)
Option 1 requires politicians to cut spending or raise taxes. Both are unpopular. Option 2 requires faster economic growth than the rate at which you're adding debt. This is theoretically possible but practically unlikely when you're borrowing trillions per year.
Option 3, the one we're currently using, is to ignore the problem and hope math stops working.
How This Usually Ends
Countries with debt-to-GDP ratios above 100% typically experience:
- Higher interest rates (lenders want compensation for risk)
- Inflation (printing money to pay debts)
- Slower economic growth (resources go to debt service instead of investment)
- Currency devaluation (nobody wants your money)
- Austerity (sudden, forced spending cuts when lenders stop lending)
Or they experience economic growth so explosive that it outpaces debt accumulation. This happens approximately never.
Sources: GAO Financial Report 2008, Wikipedia: United States Federal Budget
Podcast: Play in new window | Download
Comments