The World's Largest Experiment (That Nobody's Looked At)
There are about 200 countries, 50 US states, and millions of cities on Earth. Each one has been making policy decisions for decades, sometimes centuries. They've been passing laws, setting tax rates, funding programmes, regulating industries, and occasionally invading each other. The results of all of these decisions are meticulously recorded in economic statistics, health data, and the general mood of people in pubs.
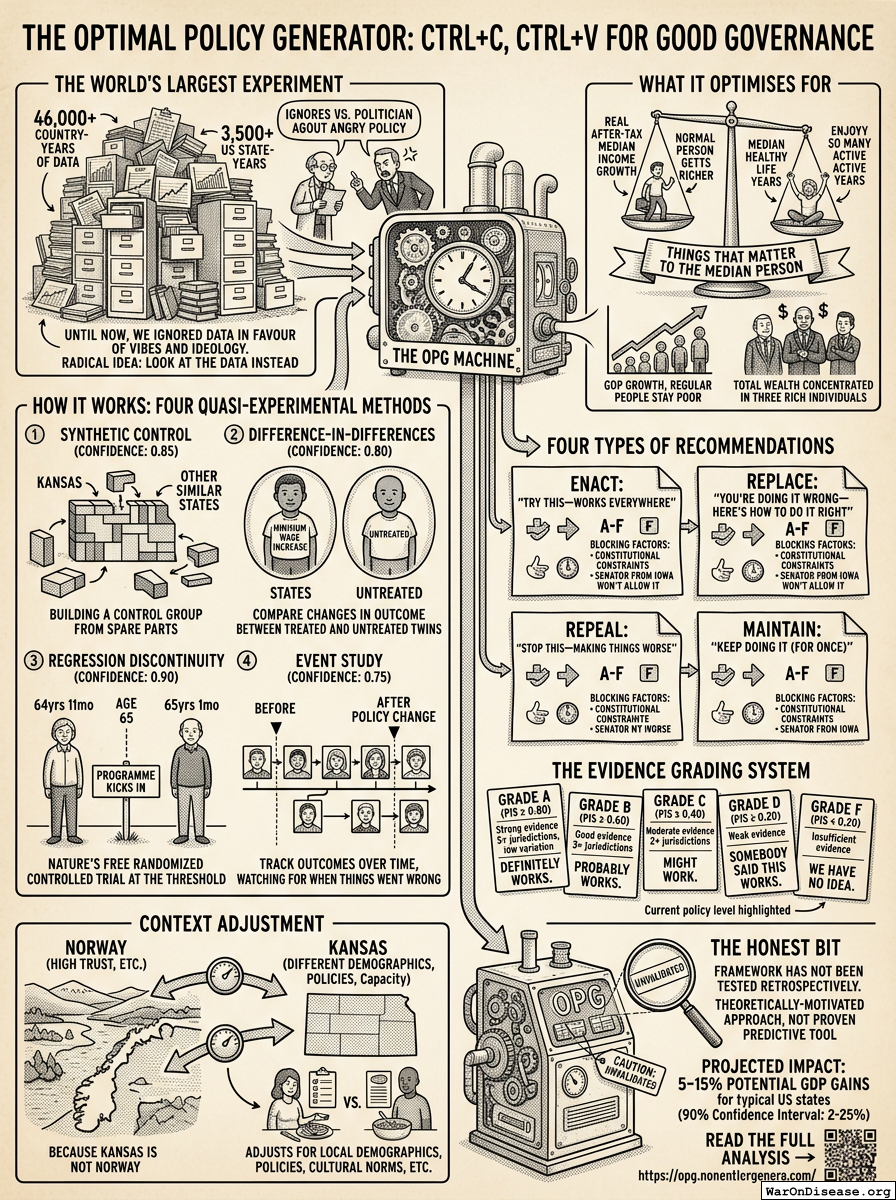
This is, collectively, the largest natural experiment in human history—46,000+ country-years of data and 3,500+ US state-years of policy variation. And we have, until now, largely ignored it in favour of arguing about policy based on vibes, ideology, and whatever the last person on the television said.
The Optimal Policy Generator proposes looking at the data instead. Radical.
How It Works: Four Methods That Sound Complicated But Aren't
The OPG uses four quasi-experimental techniques, which I will now explain using metaphors because the actual maths would make your eyes glaze over:
Synthetic Control (Confidence: 0.85): "What would Kansas look like if it hadn't cut taxes?" You build a synthetic Kansas out of bits of other states that were similar to Kansas before the tax cut, and then compare. It's like having a control group, except the control group is assembled from spare parts.
Difference-in-Differences (Confidence: 0.80): "Did the states that raised the minimum wage do better than the ones that didn't?" Compare the change in outcome in treated states versus untreated states. It's the statistical version of "which twin wore it better?"
Regression Discontinuity (Confidence: 0.90): "What happens right at the threshold?" If a programme kicks in at age 65, compare people who are 64 years and 11 months old to people who are 65 years and 1 month old. They're basically identical except one gets the programme. It's nature's randomised controlled trial, and it's free.
Event Study (Confidence: 0.75): "What happened before and after the policy changed?" Track outcomes over time and look for the moment things got better or worse. It's like watching someone's dating profile photos in chronological order—you can usually spot when things went wrong.
What It Optimises For
Two things, weighted equally:
- Real after-tax median income growth (how much richer are normal people getting?)
- Median healthy life years (how long do normal people live in good health?)
Not GDP growth, which can go up while regular people get poorer. Not total wealth, which can increase while being concentrated in three people. Median income and healthy life years—the things that matter to the person in the middle, who is by definition the most representative person in the country.
Four Types of Recommendations
The OPG generates four kinds of advice, like a very well-informed friend who happens to have read 46,000 country-years of data:
- ENACT: "You should try this—it works everywhere else"
- REPLACE: "You're doing this wrong—here's how to do it right"
- REPEAL: "This is making things worse—stop doing it"
- MAINTAIN: "This is working—keep doing it (for once)"
Each recommendation includes expected effects on both metrics, a confidence grade (A through F), and a list of blocking factors like "constitutional constraints" or "the senator from Iowa won't allow it."
The Evidence Grading System
Not all evidence is created equal. The OPG grades recommendations like a school report:
- Grade A (PIS ≥ 0.80): Strong evidence from 5+ jurisdictions with low variation. "This definitely works."
- Grade B (PIS ≥ 0.60): Good evidence from 3+ jurisdictions. "This probably works."
- Grade C (PIS ≥ 0.40): Moderate evidence from 2+ jurisdictions. "This might work."
- Grade D (PIS ≥ 0.20): Weak evidence. "Somebody said this works."
- Grade F (PIS < 0.20): Insufficient evidence. "We have no idea."
Currently, most policy is made at Grade D or F. Politicians routinely implement sweeping changes based on ideology, donor preferences, or something they heard on a podcast. The OPG suggests that maybe—just maybe—we should check whether the policy has ever worked anywhere before inflicting it on millions of people.
Context Adjustment (Because Kansas Is Not Norway)
What works in Norway might not work in Kansas, because Norway and Kansas are different places with different demographics, existing policies, institutional capacities, and cultural norms. The OPG adjusts for this. A policy that produced great results in a country with high social trust might produce different results in a country where half the population thinks the other half is trying to destroy civilization.
This is called "context adjustment," and it's the difference between saying "eat what the thin person eats" and "eat what a person with your exact metabolism, activity level, and food allergies should eat." The second one is more useful but requires more data. Fortunately, we have 46,000 country-years of it.
The Honest Bit
The paper explicitly notes that this framework is unvalidated. It hasn't been tested retrospectively to see whether its recommendations would have produced better outcomes. It's a "theoretically-motivated approach," not a proven predictive tool. This is refreshingly honest for an academic paper, like a restaurant that says "we think this is good but honestly we haven't tasted it yet."
Projected impact: 5-15% potential GDP gains for typical US states, with a 90% confidence interval of 2-25%. Even at the bottom of the range, that's a lot of money for the cost of reading a spreadsheet.
Comments