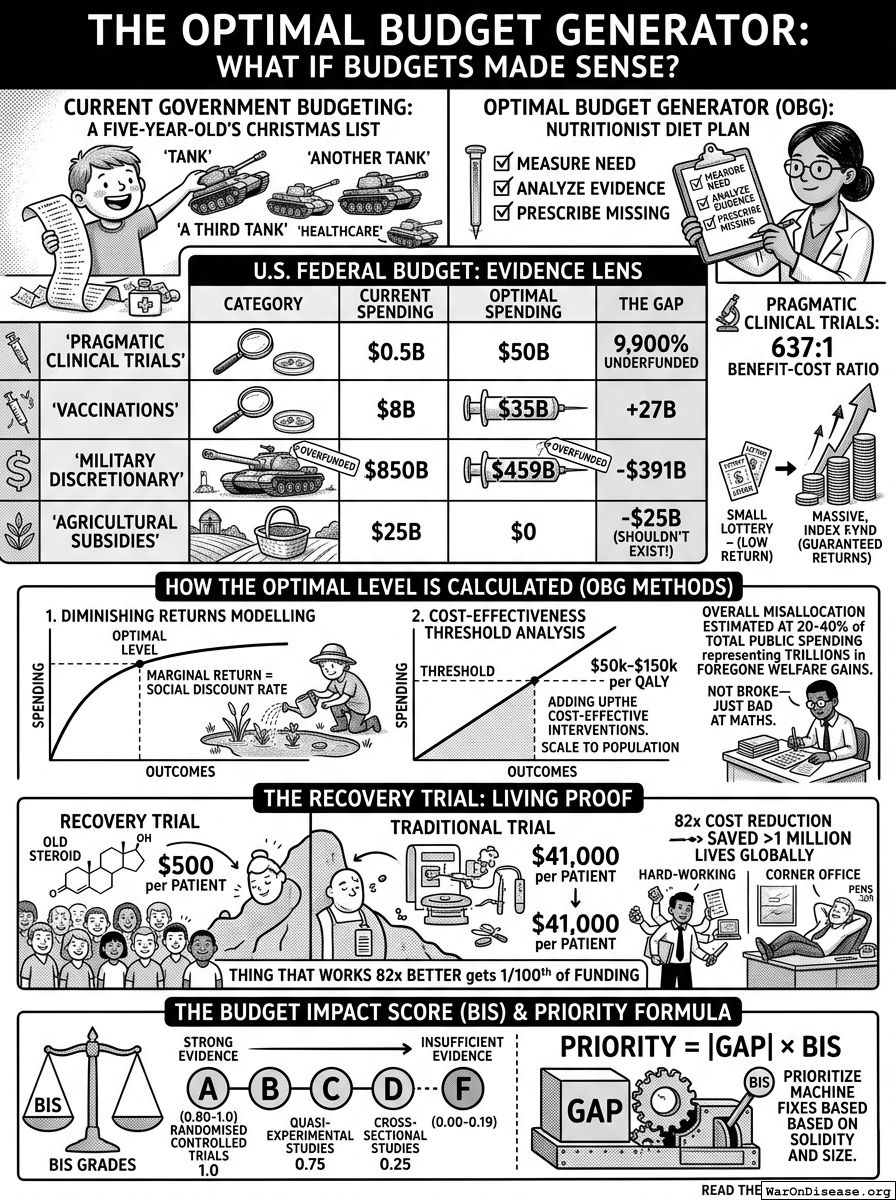
A Spreadsheet That Could Save the World
Imagine if government budgets were created the way a nutritionist creates a diet plan—looking at what you need, measuring what you have, and prescribing what's missing. Currently, government budgets are created the way a five-year-old creates a Christmas list: "I want a tank, and another tank, and also a third tank, and maybe some healthcare if there's any money left."
The Optimal Budget Generator does for spending what Recommended Daily Allowances did for vitamins. It determines an Optimal Spending Level (OSL) for each budget category based on evidence of what actually produces results. And the results are, predictably, devastating.
The Gap Between What We Spend and What We Should
Here's the US federal budget through the lens of someone who has looked at evidence:
| Category | Current | Optimal | Gap |
|---|---|---|---|
| Pragmatic clinical trials | $0.5B | $50B | +$49.5B (9,900% underfunded) |
| Vaccinations | $8B | $35B | +$27B |
| Military discretionary | $850B | $459B | -$391B (overfunded) |
| Agricultural subsidies | $25B | $0 | -$25B (shouldn't exist) |
Let that sink in. We spend $850 billion on the military and $500 million on pragmatic clinical trials—the single highest-return investment identified by the analysis, with a 637:1 benefit-cost ratio. We spend 1,700 times more on the low-return thing than the high-return thing. It's like putting all your retirement savings into lottery tickets while ignoring the index fund that guarantees 63,700% returns.
And agricultural subsidies? The optimal amount is zero. Not "a bit less" or "roughly the same." Zero. The evidence says that paying farmers to grow corn they can't sell is not, in fact, a good use of public money. Someone should alert the farmers, and also every senator from Iowa.
How the Optimal Level Is Calculated
Two methods, cross-checked against each other:
Diminishing Returns Modelling: Plot spending against outcomes across many countries. At some point, each additional dollar produces less benefit than the previous one. The optimal level is where the marginal return equals the social discount rate (about 3-7%). Beyond that point, you're throwing money at a problem that's already been solved, like watering a plant that's in a lake.
Cost-Effectiveness Threshold Analysis: Add up every intervention below the willingness-to-pay threshold ($50,000-$150,000 per quality-adjusted life year), then scale to the population. This tells you how much you could usefully spend before running out of cost-effective things to spend it on.
Both methods agree: we massively overspend on some things and massively underspend on others. The overall misallocation is estimated at 20-40% of total public spending, representing trillions in foregone welfare gains. We're not broke—we're just bad at maths.
The RECOVERY Trial: Living Proof
The UK's RECOVERY trial tested dexamethasone—a cheap, boring, old steroid—on COVID patients and found it saved lives. Cost per patient: about $500. Traditional trial cost: $41,000. The 82x cost reduction meant they could test more drugs, on more people, faster. The result potentially prevented over a million COVID deaths globally.
And yet globally, we spend about $500 million on pragmatic trials versus tens of billions on traditional ones. The thing that works 82 times better gets 1/100th of the funding. It's like having two employees, one who does 82 times more work, and giving the lazy one a corner office and a pension.
The Budget Impact Score
Not all evidence is created equal. The OBG rates each recommendation's confidence using a Budget Impact Score (BIS) from 0 to 1:
- Randomised controlled trials: weighted at 1.0
- Quasi-experimental studies: 0.75
- Cross-sectional studies: 0.25
Grades range from A (0.80-1.0, strong evidence) to F (0.00-0.19, insufficient evidence). Recommendations are only prioritised when evidence is strong. This is not guesswork dressed up as science—it's actual science, which is why it looks so different from the current budget.
The Priority Formula
Categories are ranked for reallocation by: Priority = |Gap| × BIS
This means you fix the biggest gaps first, but only when the evidence is solid. You don't rip $391 billion from the Pentagon based on a single cross-sectional study. You start with the interventions where the evidence is overwhelming—like pragmatic trials at 637:1 returns—and work outward.
The framework doesn't claim to solve everything. It can't address implementation capacity, distributional effects, or political feasibility. But it can tell you, with a high degree of confidence, that you're spending 9,900% too little on the thing that works best, and perhaps you should look into that.
Comments