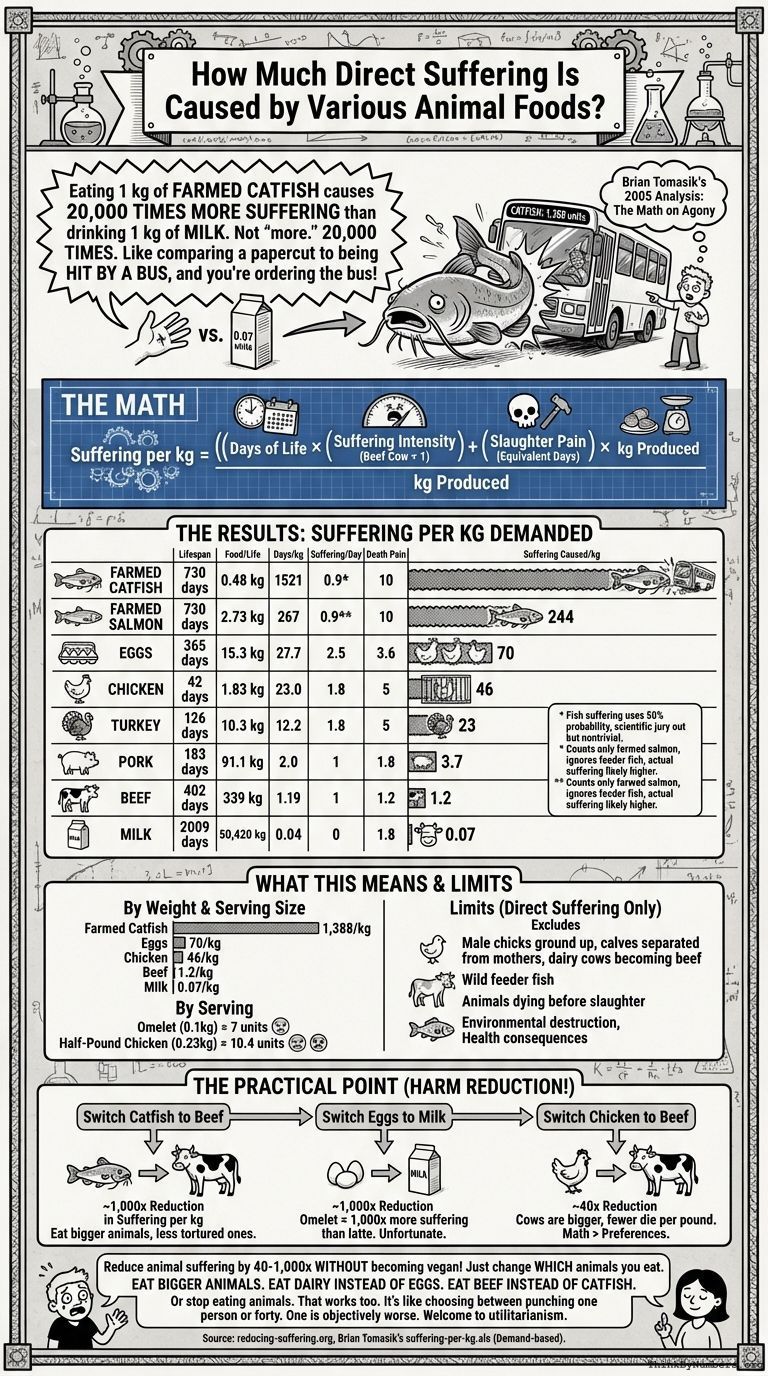
Eating one kilogram of farmed catfish causes 20,000 times more suffering than drinking one kilogram of milk.
Not "more suffering." 20,000 TIMES more suffering. That's like comparing a papercut to being hit by a bus, except you're the one ordering the bus.
This comes from Brian Tomasik's 2005 analysis, which means someone did the math on agony. The results are below.
If you care equally about suffering regardless of which animal is suffering, you should care VERY unequally about which animals you eat. A catfish sandwich and a glass of milk are not morally equivalent. One is 20,000 times worse. The math is third grade. You have third grade. The confusion is notable.
The Math
The calculation tracks three factors:
- Days of farm life per kg of food produced
- Suffering intensity per day (relative scale)
- Pain of slaughter (converted to equivalent days of life)
Formula: Suffering per kg = ((days of life × suffering per day) + (suffering per day × slaughter pain)) / kg produced
The Results
| Column 1 | 2 | 3 | 4 | 5 | 6 | 7 |
| Animal or Food Product | Average lifespan (days) | Average amount of food produced per lifetime (kg) | Expected days of life caused per kg of meat demanded | Suffering per day of life (beef cows = 1) | Number of days of life equivalent to pain of death | Expected suffering caused per kg demanded |
| Farmed catfish | 730 | 0.48 | 1521 | 0.9* | 10 | 1388 |
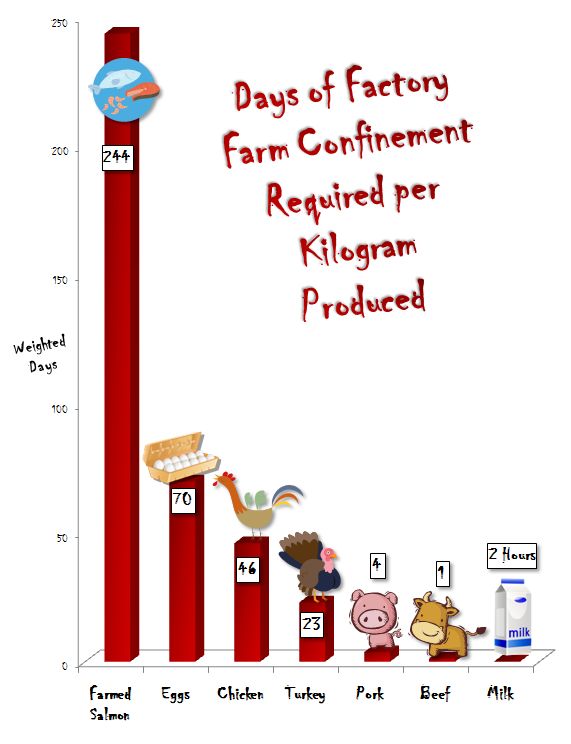
| Farmed salmon | 730 | 2.73 | 267 | 0.9* | 10 | 244** |
| Eggs | 365 | 15.3 | 27.7 | 2.5 | 3.6 | 70 |
| Chicken | 42 | 1.83 | 23.0 | 1.8 | 5 | 46 |
| Turkey | 126 | 10.3 | 12.2 | 1.8 | 5 | 23 |
| Pork | 183 | 91.1 | 2.01 | 1.8 | 5 | 3.7 |
| Beef | 402 | 339 | 1.19 | 1 | 9 | 1.2 |
| Milk | 2009 | 50,420 | 0.040 | 1.8 | 5 | 0.07 |
* Fish suffering estimate uses 50% probability of fish sentience to be conservative. Actual probability is likely higher (around 80%). The scientific jury is still out on fish pain, but the possibility is nontrivial.
** This analysis counts only the farmed salmon's suffering. It ignores the many times more small fish killed to feed the salmon. When you include feeder fish, large farmed fish like salmon likely cause more suffering per kilogram than the table shows.
What This Means
By weight of food:
- Farmed catfish: 1,388 suffering units per kg
- Eggs: 70 suffering units per kg
- Chicken: 46 suffering units per kg
- Beef: 1.2 suffering units per kg
- Milk: 0.07 suffering units per kg
By serving: Different foods have different serving sizes. A two-egg omelet (0.1 kg) causes 7 suffering units. A half-pound of chicken (0.23 kg) causes 10.4 suffering units. The chicken causes more total suffering despite eggs ranking higher per kilogram.
The Limits of This Analysis
This counts only direct suffering of the animal eaten. It excludes:
- Male chicks ground up in egg production
- Calves separated from mothers in dairy
- Dairy cows eventually becoming beef
- Wild fish caught to feed farmed fish (often many times the farmed fish weight)
- Animals that die before slaughter
- Environmental destruction
- Health consequences of eating different meats
Include those factors and the ratios change, generally making animal products worse.
The Practical Point (That Will Ruin Breakfast)
If you eat animal products, WHAT you choose matters more than WHETHER you choose them.
Switching from catfish to beef: ~1,000× reduction in suffering per kilogram
- Same amount of food
- 1,000× less suffering
- You're still eating animals, just less-tortured ones
Switching from eggs to milk: ~1,000× reduction in suffering per kilogram
- Your omelet causes 1,000× more suffering than your latte
- This is unfortunate because omelets are delicious
- Life is suffering (for you AND the chickens)
Switching from chicken to beef: ~40× reduction in suffering per kilogram
- Cows are bigger so fewer die per pound of meat
- Chickens are smaller so more suffer per sandwich
- Math doesn't care about your preferences
The uncomfortable truth: You can reduce animal suffering by 40-1,000× without becoming vegan. Just change WHICH animals you eat.
Eat bigger animals. Eat dairy instead of eggs. Eat beef instead of catfish. You'll still be eating animals, but you'll cause vastly less total suffering. This is called "harm reduction" and it's very unpopular with both vegans (who want you to stop entirely) and carnivores (who don't want to think about it at all).
Or you could stop eating animals. That works too. But if you won't do that - and most people won't - at least eat the LESS-suffering-intensive ones. It's like choosing between punching one person or punching forty people. Both are bad. One is objectively worse.
This analysis will not make you popular at dinner parties. But dinner parties cause suffering too (social anxiety, awkward conversations, disappointing cheese plates), so maybe skip them entirely and eat beef alone in your kitchen while contemplating the moral weight of your dietary choices.
Welcome to utilitarianism. It's very fun here.
The Data
This analysis comes from Brian Tomasik's original work. You can download the spreadsheet (suffering-per-kg.xls) and adjust the suffering estimates yourself.
The data sources are documented at reducing-suffering.org.
Note: These figures are per kg demanded, not per kg eaten. If you get meat from dumpster diving, you're not creating demand, so you're not causing suffering. There are other circumstances where eating animal products might not contribute to animal suffering (see Does Vegetarianism Make a Difference?).


Comments